TECHNICAL SOLUTIONS
Smart Mapping & Data Tools
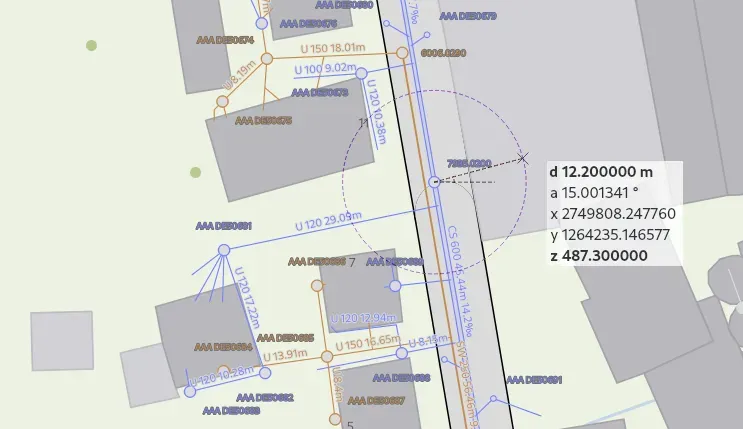
We use professional mapping software - SCALGO Live GIS and QGIS - to create the visual evidence and calculations needed for planning applications. These tools help us capture site data accurately, create clear maps showing constraints, and deliver assessments faster with better evidence.
TECHNOLOGY OVERVIEW
Smart Tools for Better Results
We use two main mapping platforms - SCALGO Live GIS and QGIS - to create the maps, calculations, and visual evidence needed for planning applications. These tools help us work faster and more accurately, which saves time and money.
Think of them as advanced mapping software that shows flood zones, drainage paths, and environmental constraints all in one place - like Google Maps but specifically designed for environmental assessments.
FIELD DATA PLATFORM
SCALGO Live GIS Platform
SCALGO Live GIS is our primary field data collection platform - a cloud-based system that our team uses on tablets when they visit your site. It ensures all the information we gather is accurate, backed up, and immediately available for assessment work.
What
Skalgo Does
SCALGO Live GIS is our main field data collection tool. When our team visits your site, they use tablets connected to SCALGO to record exactly what they see - taking photos, marking locations, and recording measurements.
Everything gets automatically uploaded to the cloud, so the office team can immediately see what's happening on site. This means no lost paperwork, no transcription errors, and faster turnaround times.
GPS-located photos and notes from site visits
Automatic backup of all site data to the cloud
Instant sharing between field and office teams
Works offline in areas with no mobile signal
Creates maps showing all the constraints on your site
Generates reports with all the evidence in one place
OPEN SOURCE POWER
QGIS Platform
Alongside SCALGO Live GIS, we use QGIS - a powerful open-source mapping platform that gives us unlimited flexibility for complex environmental analysis without licensing constraints.
QGIS
Capabilities
QGIS allows us to combine multiple data sources into clear, professional maps. We can overlay Environment Agency flood data, Ordnance Survey mapping, aerial photography, and site surveys to create comprehensive visual assessments.
The platform's open-source nature means we can customize it for specific project needs, automate repetitive tasks, and integrate with other systems without restriction.
Free from licensing costs - savings passed to clients
Unlimited mapping layers for complex sites
Direct import of surveyor data and CAD drawings
Professional map outputs for planning submissions
Automated area calculations and measurements
Compatible with all standard GIS data formats
REAL BENEFITS
How These Tools Help Your Project
Our mapping and data tools aren't just fancy software - they solve real problems that can delay or derail planning applications:
Faster Site Visits
All data captured first time - no return visits needed
Photos automatically linked to exact locations
Measurements recorded digitally - no lost notebooks
Instant upload means office work can start immediately
Works in remote areas with no phone signal
Better Evidence
Professional maps that planning officers understand
Clear visuals showing flood zones and constraints
Photographic proof with dates and locations
All calculations checked and verified
Evidence organized exactly how councils need it
Cost Savings
No repeated site visits saves survey costs
Faster assessments mean lower fees
QGIS has no licensing costs to pass on
Accurate data reduces risk of application rejection
Digital storage means no lost documents
Peace of Mind
All data backed up securely in the cloud
Full audit trail if councils ask questions
Version control tracks all document changes
Team collaboration prevents miscommunication
Quality checks built into the process
SUPPORT TOOLS
Other Helpful Technology
Beyond SCALGO Live GIS and QGIS, we use various other tools to make sure everything runs smoothly:
Environment Agency Data
Direct access to official flood maps and historic flood records that planning authorities require.
Causeway Flow
Drainage design software with powerful hydraulic modeling that creates compliant and sustainable storm water network solutions.
Calculation Tools
Pre-built calculators for drainage, nutrients, and flood risk that match what councils expect.
Report Templates
Standardised formats that match exactly what planning officers need to see for approval.
Cold Storage
Secure backup of all project files with version tracking so nothing gets lost or overwritten.
Quality Checks
Built-in verification that flags potential issues before submission to avoid rejections.
The Bottom Line
750+
Environmental assessments completed across the UK
35+
Years combined experience
71
Local planning authorities affected by neutriuent neutrality.
94%
Approval rate